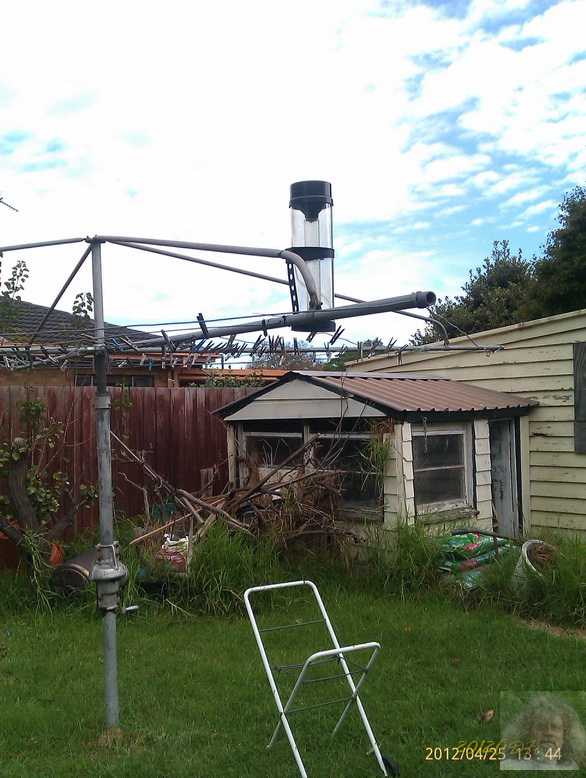
Current Weather and trends and in Sale if I have the monitor system up and running.This is my system out my back door  Since extended my mast a few feet to catch the wind better.
Australian Meteorological site local rain Radar BOM
Australian continent Lightning history [was here.]90 Mile Beach Gippsland weather at nearby Paradise Beach
other country Victorian sites: Ocean Grove trends Ballarat Berwick
Here is another fun site World Cloud Animation
Rainfall since 1999 Since 1999 when my father-in-law Ken gave me a rain gauge, I have pretty well kept a constant record of rain fall on the backyard. I shall endeavour to keep this page updated. The gauge was affixed to the NE corner of the bungalow, about 2.5m up. Now it is on the clothes line where I can reach it easily instead!
Data goes into a spreadsheet, add additional information, graphed as follows of what has happened locally since 1999.The Weather in my backyard last 24 hours Since extended my mast a few feet to catch the wind better.Australian Meteorological site local rain Radar BOM
Australian continent Lightning history [was here.]90 Mile Beach Gippsland weather at nearby Paradise Beach
other country Victorian sites: Ocean Grove trends Ballarat Berwick
Here is another fun site World Cloud Animation
Rainfall since 1999 Since 1999 when my father-in-law Ken gave me a rain gauge, I have pretty well kept a constant record of rain fall on the backyard. I shall endeavour to keep this page updated. The gauge was affixed to the NE corner of the bungalow, about 2.5m up. Now it is on the clothes line where I can reach it easily instead!
Updated rainfall charts


We all know the weather controls us. Face it, it just cannot be any other way. We also have to acknowledge that things change.
The Mediterranean, Port Philip Bay. These places were not there before the Pyramids! The beaches we are so attached to, covered in the great vegetation we all used to run through and hide, are relatively new, are ephemeral in the grand design of things.
Mean while we can document the evolution of our surroundings, or I want to.
Hence the above site to watch the weather.
My active weather site is because I always wanted a weather station.
I have three wall clocks with analog thermometers, hygrometers and one with a barometer.
One tocked too loudly, and was banned from the bedroom.
Then I got a digital weather station that gave me inside and outside temp and humidity.
A year later I got a full weather station kit with wind direction and strength and weather prediction!
This I could put out on the web if I wanted to. So I did
I use Cumulus from Sundaysoft, an Orkney based programmer, & donated I like it so much- and I have become a real part of a weather monitoring web.
The graphs below are my 9.00am rainfall readings recorded on (groan) Microsoft Excel.
I heard today that 2010 rain i the district was below average- bah- I see from my records it is not.
There also seems to be a cycle or trend that lasts about three years.
Overall rain seems to be decreasing since I started my records.
Rainfall records from my the backyard since 1999 are now to be seen at my weather data blogged here


Can anyone else offer an explanation for the cycle cribbed from the mean moving average?
I can make out a cycle of roughly three years, and decreasing peak trends...
No comments:
Post a Comment